
Insights
IT Metrics Spotlight: IT spend as a % of total spend, comparison by agency
A common high-level metric that many IT leaders look at for context when thinking about their IT performance is IT spend as a percentage of total spend. Using data from itdashboard.gov and individual agency financial reports and comparing across agencies, we see the following:
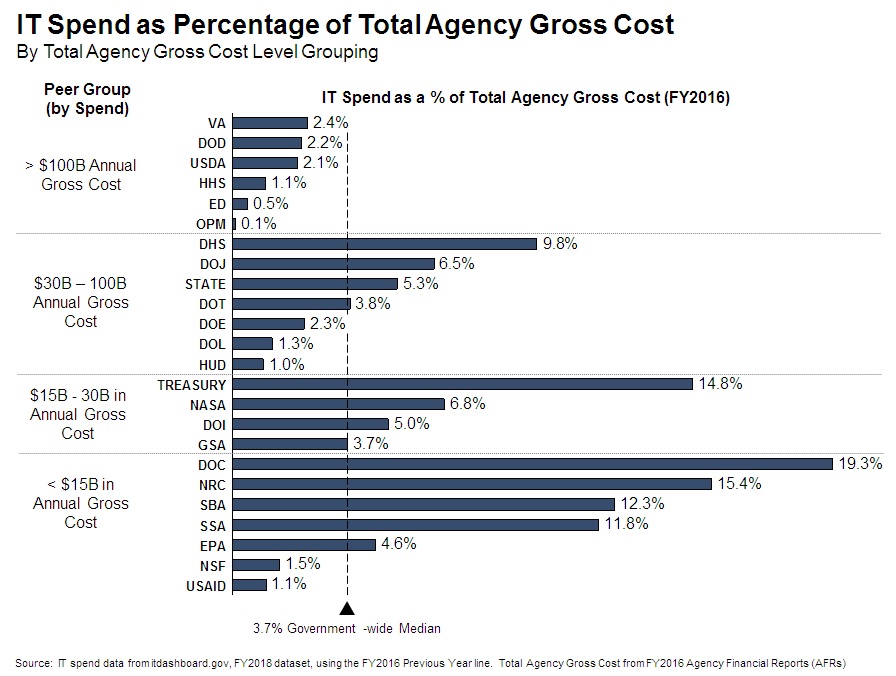
There is no “right” level of IT spend as a % of total agency gross cost. The missions of the agencies and therefore the level of IT required to enable and support the mission vary significantly. However, looking at this metric comparatively may help set context and act as a starting point for IT leaders as they continue to analyze and optimize their IT spend.
Data source notes:
- IT spend by agency is reported on itdashboard.gov and the total spend from the IT portfolio view is used as the numerator. Not all IT spend in an agency may be reported through this channel, so it is possible the total IT spend within an agency may be higher. As funding may be decentralized within an agency, many programs receive funds directly and spend it on IT to support the program. These expenditures may not be easily visibile to the agency’s central CIO when agencies do not have a centralized IT spend reporting.
- The total agency gross cost is used as the denominator. Agency funding sources can vary and some agencies may collect “revenue” from various sources. The total agency gross cost represents the amount of money the agency spends to fulfill its mission. The gross costs can be found in the individual agency financial reports.
The author thanks Adam Walters for contributions to the analysis